247Monitor

Website · API · SSL · DNS · Cron · Browser · Server

Website and server monitoring in one platform.

Check your sites, APIs and cron jobs from around the world — then watch the CPU, memory and disk of the servers behind them with a lightweight agent. One dashboard, alerts in under 30 seconds, free to start.

25 monitors free · server agent included · no credit card
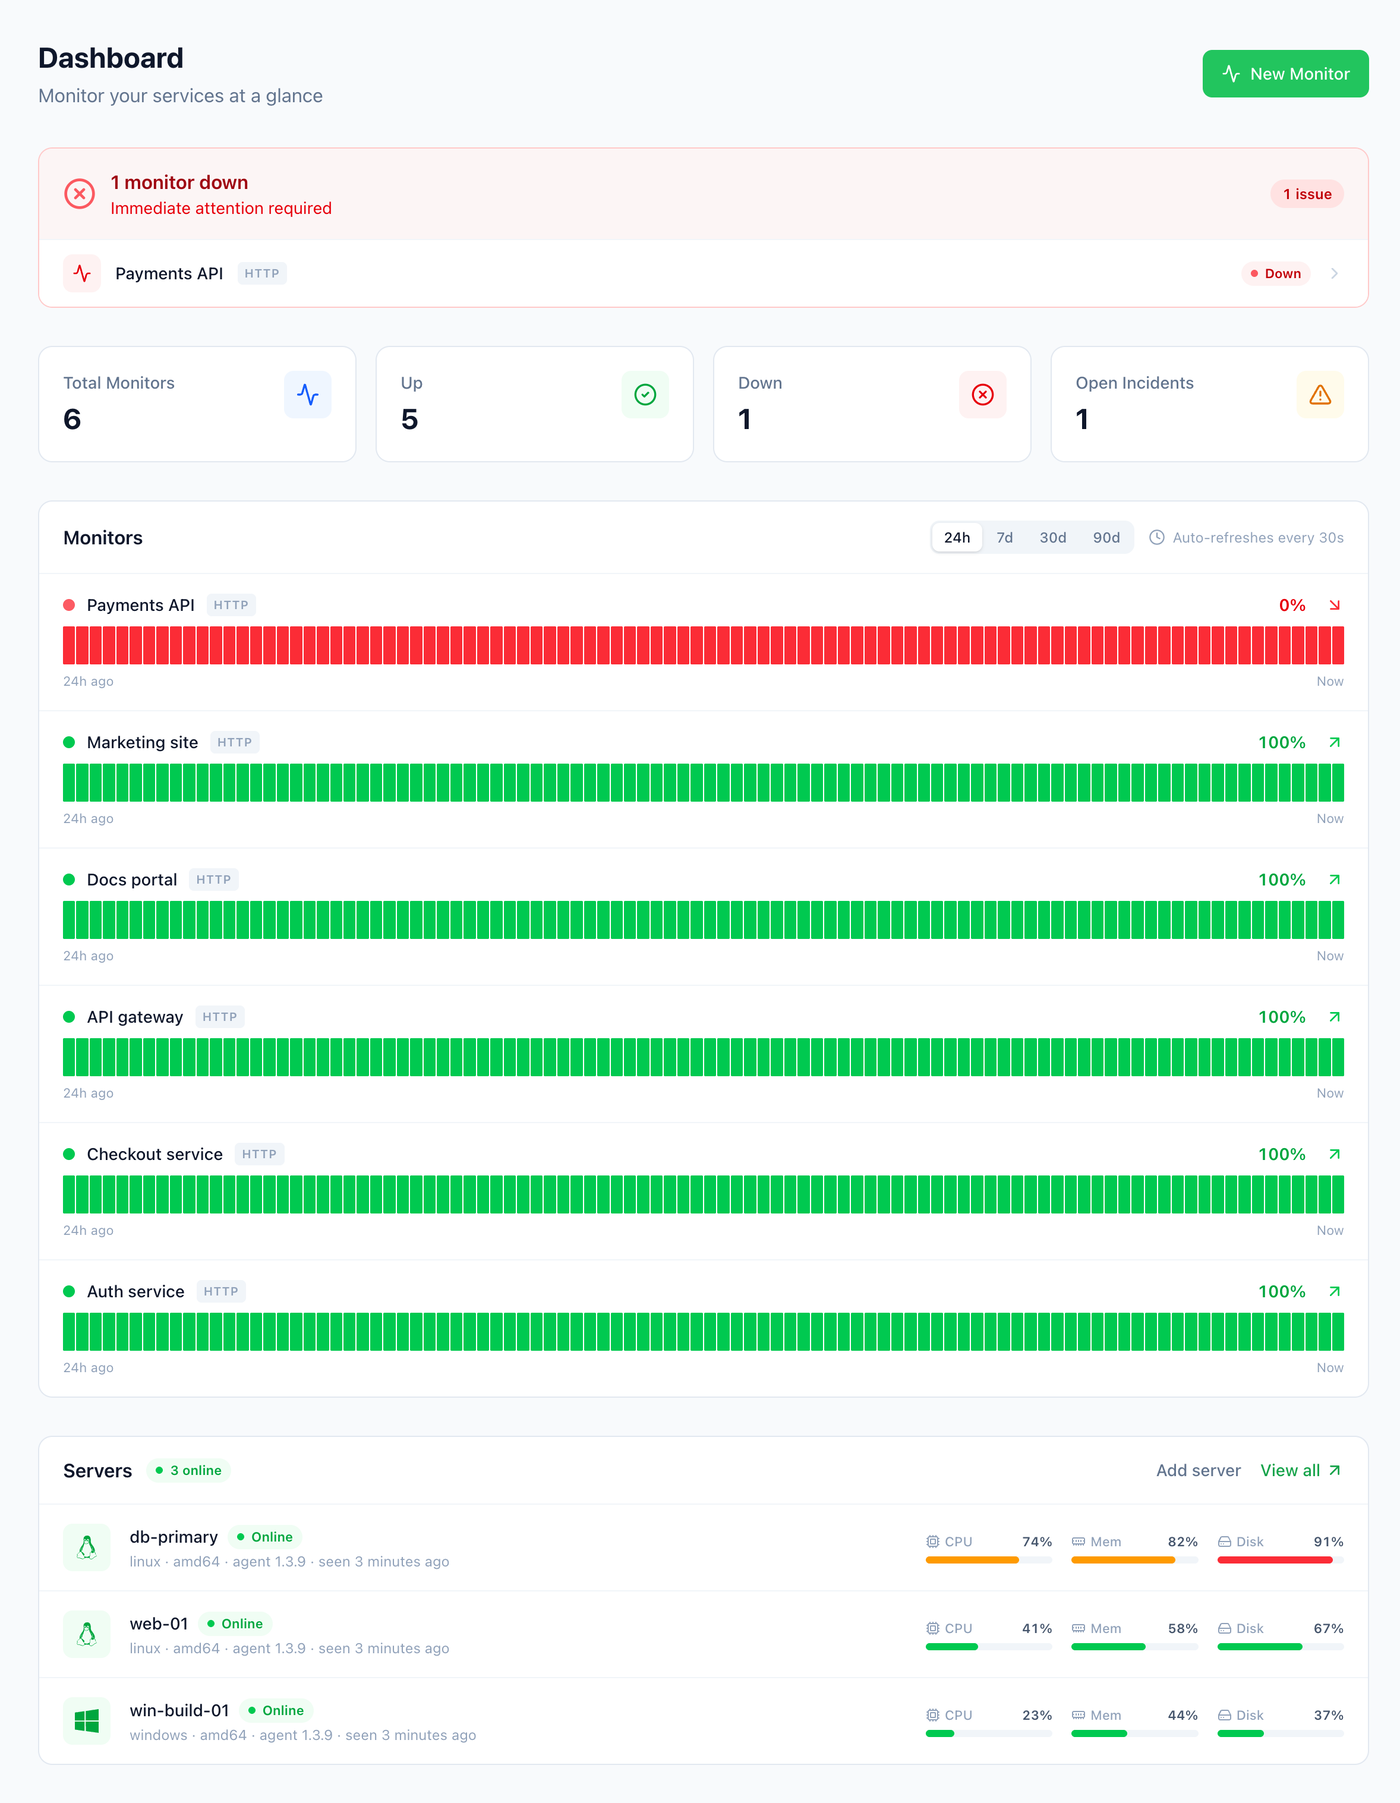
app.247monitor.net/dashboard
247Monitor dashboard showing website monitors and server health together, with a live incident

Monitor types

Cover every layer of your stack.

A green homepage hides a lot: an expiring certificate, a silent cron job, a checkout that fails on the final click. 247Monitor watches the whole stack — from the front door to the servers behind it.

HTTP & keyword

Status codes, response times, and the words that should — or shouldn't — be on the page.

Server agent

CPU, memory, disk, network and processes from inside your Linux and Windows hosts.

SSL certificates

Certificate-expiry warnings with weeks of notice — no midnight renewals.

Domain expiry

Renewal reminders for your domains, so a lapsed registration never takes you offline.

Port & ping

Mail servers, databases, game servers — if it listens, we'll confirm it's listening.

DNS

Record changes and resolution failures, caught before customers see “doesn't exist”.

Heartbeat / cron

Your backup job pings us when it runs. The moment it goes quiet, you hear about it.

Browser journeys

A real Chromium browser logs in, adds to cart and checks out — every few minutes.

Server monitoring · included from the free plan

Deep visibility into the servers behind your services.

Black-box checks prove the service answered. A lightweight agent proves the box behind it is healthy — and warns you before a filling disk, a memory leak or a pegged CPU becomes the outage.

  • CPU, memory, disk and network — plus load, disk I/O and a full host inventory
  • Alert on a threshold, a stopped service, a vanished process — or the host going dark
  • Metrics charted with history, right beside the uptime of what runs on top
LinuxWindows
install the agent · ~30s
# one line — enrols with your token and starts on boot
$ curl -fsSL https://get.247monitor.net | sudo bash
Explore server monitoring →
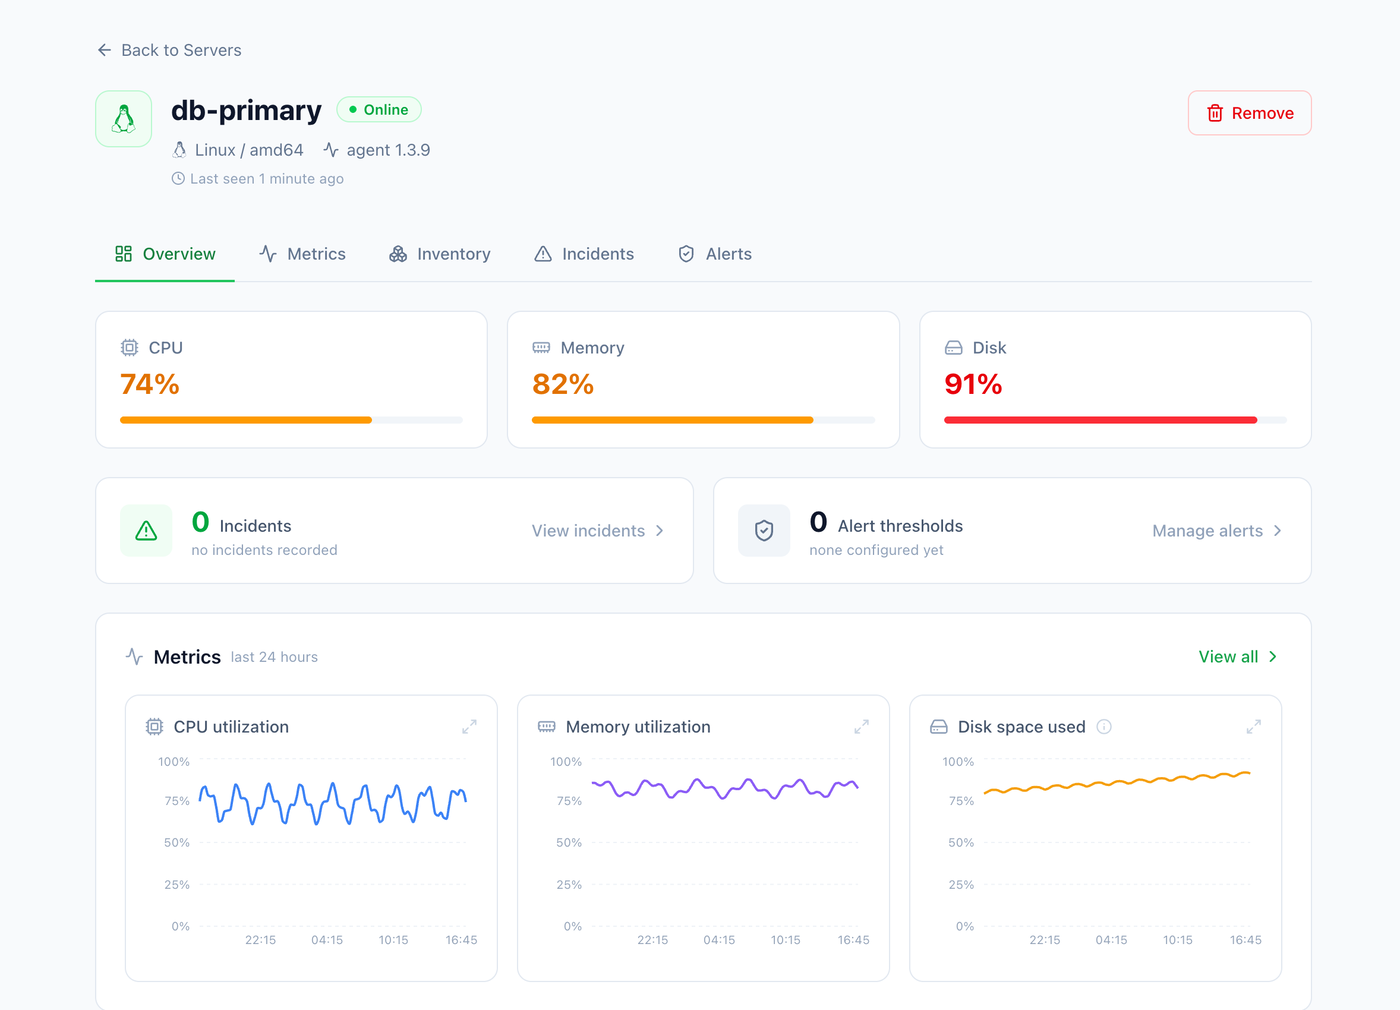
app.247monitor.net/servers/web-01
247Monitor server detail showing CPU, memory and disk gauges with 24-hour metric charts and host inventory

Browser journeys

Real-browser checks for the flows that earn revenue.

A real Chromium browser walks your critical paths every few minutes. When a step fails you get the screenshot, console logs, request waterfall and a downloadable Playwright trace — everything you need to fix it before the first support ticket.

  • Real Chromium and Firefox, not a HEAD request with ambitions
  • Multi-step journeys: navigate, click, type, assert
  • Failure screenshot and HTML snapshot of the broken state
  • Console logs, request details and a downloadable trace

journey: checkout-smoke · every 5m

  1. goto /store612 ms
  2. click #add-to-cart88 ms
  3. fill [name=email]41 ms
  4. click 'Pay now'102 ms
  5. assert text 'Order confirmed'30.0 s
▣ failure.png — screenshot of the broken checkout
FAILED: expected page text to contain "Order confirmed"
failure.pngconsole.logtrace.zipsnapshot.html

Global coverage

Checked from around the world. Confirmed before we page you.

Checks run from multiple regions around the world. Every failure is confirmed across regions before anyone is woken — so an alert from us means it's really down, not one route having a moment.

Continuous checks from multiple regions · cross-region confirmation

Alerting

Alerts in the channels your team already uses.

Route alerts to where your team already works, and add notify-only seats for stakeholders who want to know — without another login to manage.

EmailSlackDiscordMicrosoft TeamsTelegramWebhooksSMS

Maintenance windows silence planned work. Incident timelines record what failed, from where, and when it recovered — so the postmortem writes itself.

Status pages

Public status pages, included on every plan.

A status page turns an outage from a support-ticket storm into a single calm announcement. Every plan ships one, with email and SMS subscribers built in.

Subscribers built in

Customers subscribe by email or SMS. When you post an incident, everyone hears it from you first.

Your brand, not ours

Custom branding on every plan — and on Business, fully white-label pages on your own domain with no trace of us.

Private pages

Internal status pages for the services only your team should see. Same calm updates, smaller audience.

Pricing

Simple, flat pricing — in pounds or dollars.

Start free and upgrade when the things you monitor start making money. Annual billing takes roughly two months off.

Free

£0 / month

For side projects that still deserve dignity.

  • 25 monitors, 1-minute checks
  • 1 server — CPU/RAM/disk/network via the agent
  • HTTP, keyword, ping, port, SSL, domain expiry, DNS & heartbeat
  • 1 public status page · 100 subscribers

Starter

£9 / month

30-second checks and real-browser synthetics for £9.

Everything in Free, plus:

  • 50 monitors, 30-second checks
  • 2 servers — agent host monitoring
  • 1 browser journey · 1,000 runs/month included
  • 2 status pages · 500 subscribers

Pro

Most popular

£29 / month

Serious capacity and a team to share the pager.

Everything in Starter, plus:

  • 250 monitors, 30-second checks
  • 5 servers — agent host monitoring
  • 5 browser journeys · 10,000 runs/month
  • 10 status pages · private pages · 2,500 subscribers

Business

£79 / month

White-label everything. Export anything.

Everything in Pro, plus:

  • 1,000 monitors, 30-second checks
  • 20 servers — agent host monitoring
  • 15 browser journeys · 30,000 runs/month
  • 25 status pages · white-label + custom domains (HTTPS)

FAQ

Frequently asked questions.

Can you monitor my servers, not just my websites?

Yes. Install our lightweight agent on a Linux or Windows host and you'll see CPU, memory, disk and network beside your uptime checks — with alerts when a threshold is breached, a service stops, or the host goes quiet. Every plan includes server monitoring; the free plan covers one.

How fast will I know when something goes down?

Paid plans check every 30 seconds, and alerts typically arrive within 30 seconds of a confirmed failure. We confirm across regions before alerting, so you're woken by real incidents rather than network blips.

Where do you monitor from?

We check from multiple regions around the world, so a single region having a bad day doesn't page you. Every failure is confirmed across regions before you're alerted.

What are browser journeys?

Scripted checks running in a real Chromium browser: load the page, click, type, assert. When a step fails you get a screenshot, console logs, request details and a full Playwright trace of the failure.

Is the free plan actually free?

Yes — 25 monitors, 1-minute checks, a public status page, a server agent and every alert channel, free forever. No card, no trial countdown, no surprise email on day 14.

Do you do status pages?

Every plan includes a public status page with subscriber notifications. Business plans add private pages and full white-labelling on your own domain.

Always on

Monitoring for everything your business runs on.

Websites, APIs, scheduled jobs and the servers behind them — watched around the clock, with the evidence to fix what breaks.

No credit card · 25 monitors free · 2-minute setup

Start monitoring in minutes.

Free forever for 25 monitors and a server. Add your first check, pick your alert channels, and you're live before your coffee's cold.