Server monitoring · agent-based
Server monitoring for Linux and Windows.
Track CPU, memory, disk, network, processes and services beside your external uptime checks. 24/7 host monitoring is included on every plan, with one host on Free.
Linux · Windows · outbound connection only
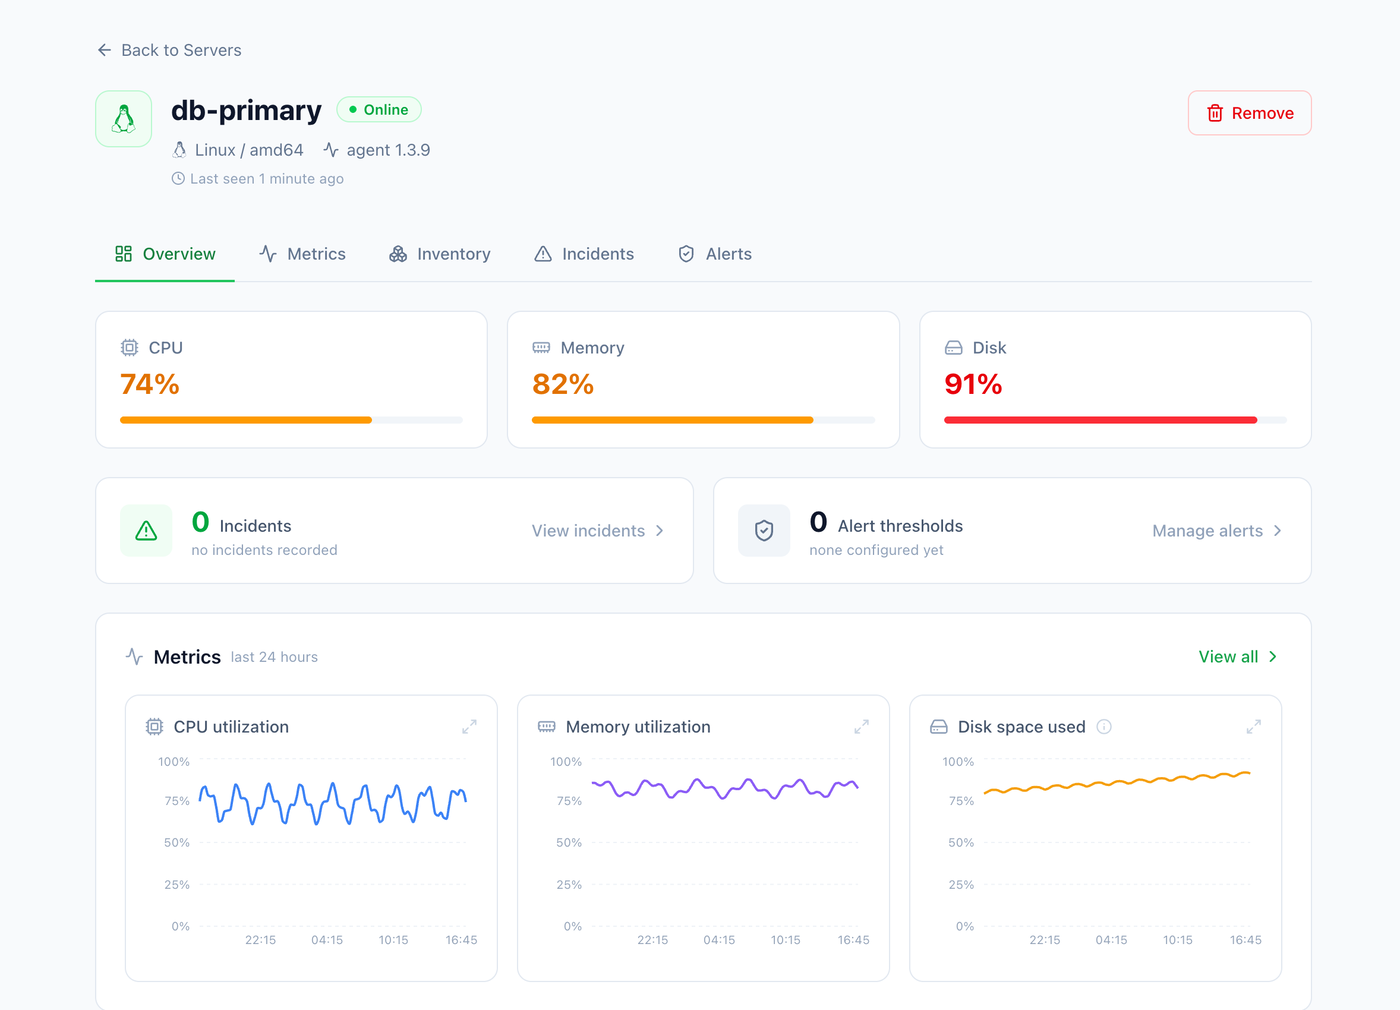
Identify host problems before they affect a service.
Alert on full disks, sustained CPU or memory use, stopped services, missing processes and lost agent connections. Historical charts help you investigate how the problem developed.
Review server health and resource use.
The agent charts system metrics with history beside the uptime of the services running on the host.
| Metric | What you see | Alert when |
|---|---|---|
| CPU & load | Per-core utilisation and load average over time | Sustained high load |
| Memory | Used, cached and available memory, including swap | Memory or swap pressure |
| Disk & I/O | Per-volume capacity and disk I/O | A volume above your threshold |
| Network | Throughput and errors per interface, plus the NIC inventory (IP and MAC) | Interface errors |
| Services & processes | Named services and the processes you expect to be running | A service stops or a process disappears |
| Host inventory | OS, kernel, uptime, agent version and hardware, captured at enrolment | Reference data; no alerts |
Simple to deploy
Install one agent on each host.
No inbound firewall rule is required. Install the agent, enrol it with your token and review incoming metrics in the dashboard.
Your hosts
The agent runs on your servers
One binary on each Linux or Windows host, enrolled with a token. Runs as a low-overhead service and keeps itself up to date.
Every few seconds
Metrics pushed securely out
CPU, memory, disk, network, load, processes and a full host inventory, pushed out over an encrypted connection. No inbound ports to open.
247Monitor
Charted, thresholded, alerted
Live charts with history beside your uptime checks, and alerts the moment a threshold, service or host crosses the line.
# one line: enrols with your token and starts on boot
$ curl -fsSL https://get.247monitor.net | sudo bash
Host alerts
Alert on resource, process and service failures.
Route host alerts to the same channels as your uptime checks, including email, SMS, Slack, Discord, Teams, Telegram and webhooks.
- A metric crosses a threshold you set (e.g. disk above 90% for 5 minutes)
- A service stops or a watched process disappears
- The agent stops reporting from the host
Incident · web-01
External checks and host metrics in one place.
Server monitoring is one half of the picture. Pair it with uptime, SSL, DNS, cron and real-browser checks, all on the same dashboard, all in your plan.
FAQ
Server-monitoring questions.
What operating systems does the agent support?
Linux and Windows. The agent is a single binary, enrolled with a team token and run as a system service.
How do I install the agent?
Use the installation command shown in your 247Monitor account. It downloads the agent, enrols the host with your team token and configures it to start with the operating system.
Do I need to open inbound ports or a firewall hole?
No. The agent pushes metrics outbound over an encrypted connection, so there's nothing inbound to expose.
Is server monitoring included on the free plan?
Yes. The free plan covers one server, and every paid plan includes more (2 on Starter, 5 on Pro, 20 on Business), with add-ons if you need extra.
No credit card · 25 monitors free
Start monitoring in minutes.
The free plan includes 25 monitors, one server and a public status page. Add your first check and choose where alerts should be sent.