Create a monitor: every type explained
A monitor is a single check that runs on a schedule. This walks through creating one and explains what each of the nine monitor types is for, so you pick the right one the first time.
6 min read
Every monitor follows the same shape: choose a type, tell us what to check, set how often, and decide who gets alerted. Here's the whole flow.
- 1
Open the create dialog
In the dashboard, go to Monitors in the sidebar and click New Monitor. The create dialog opens with the type picker at the top.
app.247monitor.net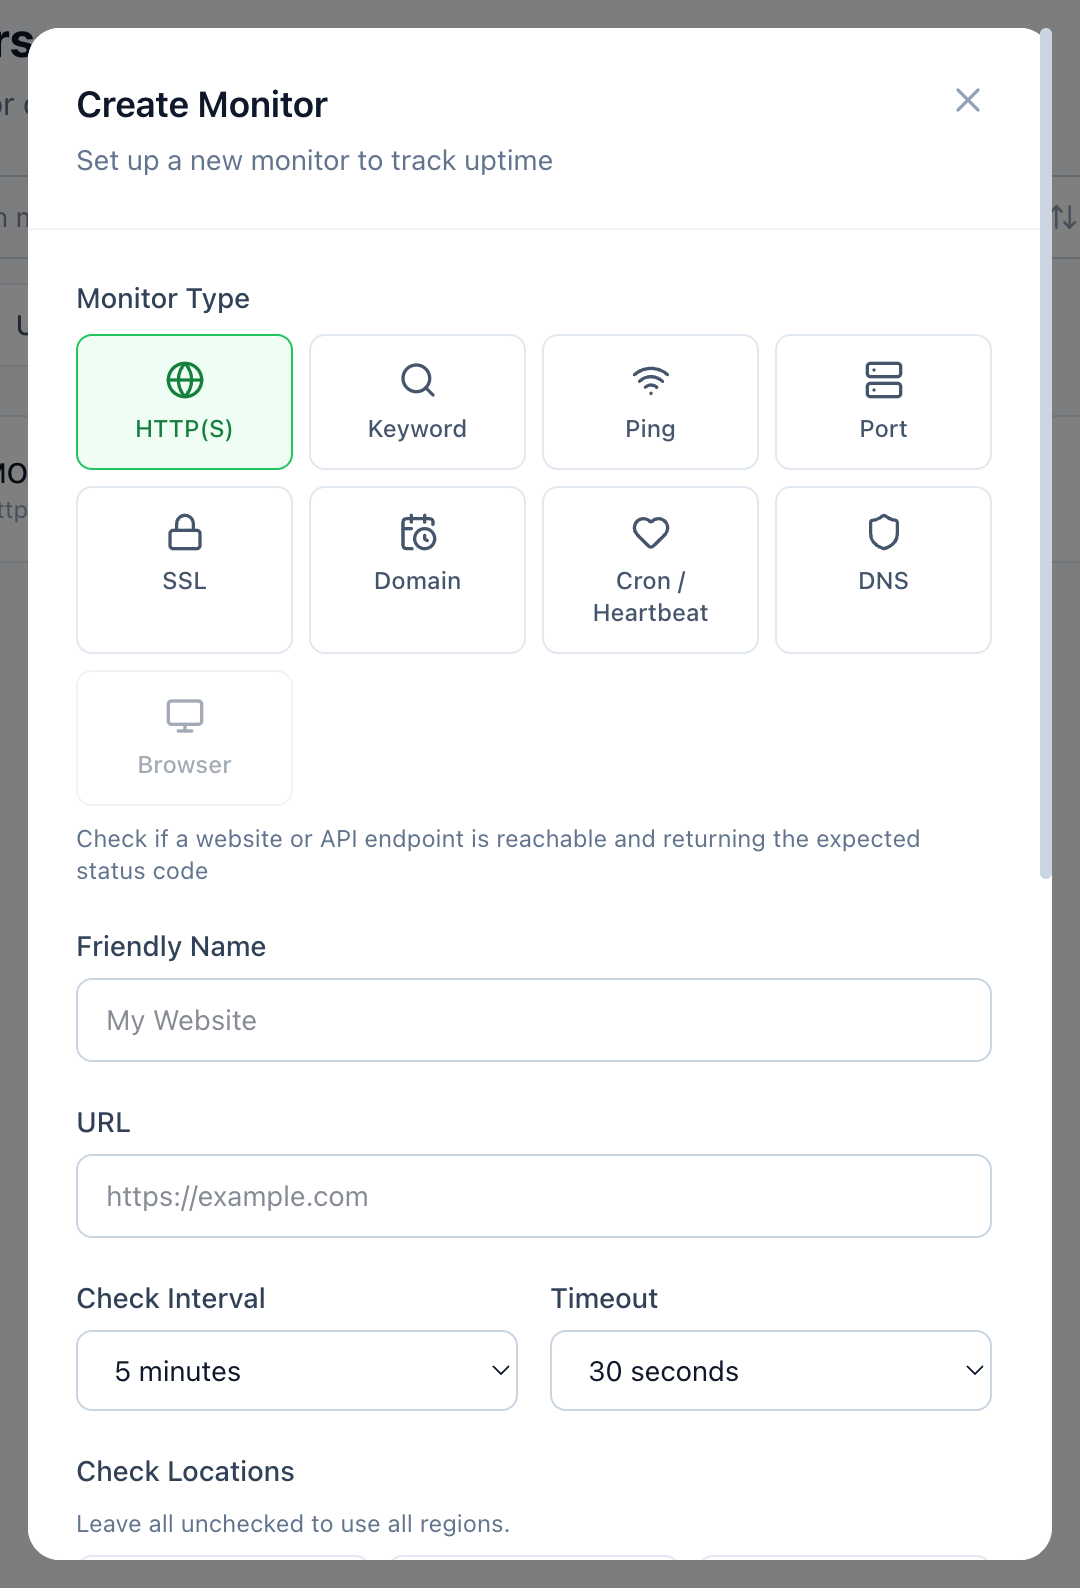
Create Monitor: pick a type, then fill in the target and schedule. - 2
Pick a monitor type
Choose the type that matches what you want to watch. The grid shows a one-line description as you select each one; full details for every type are below. Most websites and APIs want HTTP(S).
- 3
Name it and set the target
Give the monitor a friendly name you'll recognise in alerts (e.g. “Checkout API”). Then fill the target field. The label changes per type: a
URLfor HTTP/keyword/SSL, ahost or IPfor ping/port, or adomainfor DNS and domain checks. - 4
Choose interval and timeout
Check interval is how often the monitor runs; timeout is how long we wait for a response before counting it as a failure. Faster intervals are available on paid plans. A failure is confirmed from a second location before it raises an incident, so one twitchy route won't page you.
- 5
Select check locations (optional)
By default we check from all available regions around the world. Leave the locations unchecked to use them all, or pick specific regions if you only serve one part of the world.
NoteCron / heartbeat monitors are push-based (your service pings us), so they have no check locations. - 6
Decide who gets alerted
Attach the alert channels that should fire for this monitor and tune the alert policy (how many failures before we notify, repeat reminders, and so on). Haven't set up a channel yet? Add one first; see the notification guides below.
- 7
Create it
Click Create Monitor. The first result usually lands within a few seconds, and the monitor starts tracking uptime, response time and incidents straight away.
The nine monitor types
Each type checks for something different. Here's what every one watches and what you need to enter.
HTTP(S)
Watches Whether a website or API endpoint is reachable and returns the status code you expect. The default and most common check.
You enter The full URL (https://example.com). Optionally set the method, headers, auth, request body, an expected status code, and a maximum response time under Advanced.
Keyword
Watches A page that loads with a 200 but is quietly broken: it checks the response body for specific text, a regex pattern, or a JSON value, and can alert when the text is present or absent.
You enter The URL, plus the keyword/pattern to match and whether it should exist or not exist in the response.
Ping
Watches Basic network reachability: whether a host answers an ICMP echo request.
You enter A hostname or IP address (example.com or 8.8.8.8).
Port
Watches Whether a specific TCP port is open and accepting connections: databases, SMTP, SSH, game servers, anything that listens on a port.
You enter A host or IP, plus the port number (e.g. 443).
SSL
Watches TLS certificate validity and how many days remain before it expires, so you get weeks of warning instead of a midnight outage.
You enter The URL of the HTTPS endpoint. We read the certificate presented for its hostname (SNI).
Domain
Watches Domain registration expiry via WHOIS/RDAP, so a forgotten renewal never takes your whole site down.
You enter The domain (example.com). A URL or subdomain is reduced to the registrable domain automatically (www.example.co.uk → example.co.uk).
Cron / Heartbeat
Watches The absence of a thing. Your job pings a unique URL each time it runs; if a ping doesn't arrive in time, we alert you. Ideal for cron jobs, backups, ETL and queue workers.
You enter Nothing to point at: after creating it you get a unique ping URL. Set the expected interval and a grace period (default 60s) for late or retried runs.
DNS
Watches DNS records (A, AAAA, CNAME, MX, TXT, NS), catching hijacks, fat-fingered zone edits and propagation surprises.
You enter The domain, the record type to check, and optionally the expected value (leave blank to only confirm the record exists).
Browser
Watches What a real user experiences. A real Chromium browser loads your page (and can walk multi-step journeys), capturing a screenshot, console logs and a trace on failure.
You enter The URL to load. Browser checks are available on paid plans and run from selected regions.
Next steps
Once your monitor is live, make sure alerts reach you. Connect Slack, Teams, Telegram or Discord, or prefer to drive everything from code with the REST API.